How to read toner yield numbers under the ISO standards
A toner cartridge box says 16,000 pages. The next box up the price ladder says 25,000 pages. The compatible alternative says 18,000 pages and costs forty percent less. Three numbers presenting themselves as direct comparisons. Three numbers calculated under three slightly different conditions, none of which match what an ordinary office actually prints. Knowing what the numbers measure and how to translate them into the office's real conditions changes which cartridge fits the workload and the budget.
Two ISO standards govern almost every toner yield claim on the market in 2026. ISO 19752 for monochrome. ISO 19798 for color. Both standards depend on a coverage assumption that determines how the headline figure was generated.
What ISO 19752 tests for monochrome
 ISO 19752 was published in 2004 and updated through 2017. The standard defines a controlled test for monochrome toner yield. A laboratory loads a printer with the cartridge under test, configures it to print a specific page from a defined PDF document at standard quality settings, and runs continuous prints until the cartridge stops producing acceptable output. The number of pages produced before the cartridge fails is the yield rating, with a small statistical adjustment to compensate for variation between individual cartridges.
The test page used under ISO 19752 is a single A4 sheet showing roughly 5 percent toner coverage, distributed across the page in a mix of text, simple graphics, and white space. The 5 percent figure was chosen as representative of typical office text documents in the early 2000s. A page covered at 5 percent looks like a typical printed letter or a short report, with text occupying perhaps a third of the printable area at typical font weights. Where this number sits in the broader question of office print volumes and their relationship to chassis sizing, the deeper read is at The difference between duty cycle and recommended monthly volume and why it matters.
What ISO 19798 tests for color
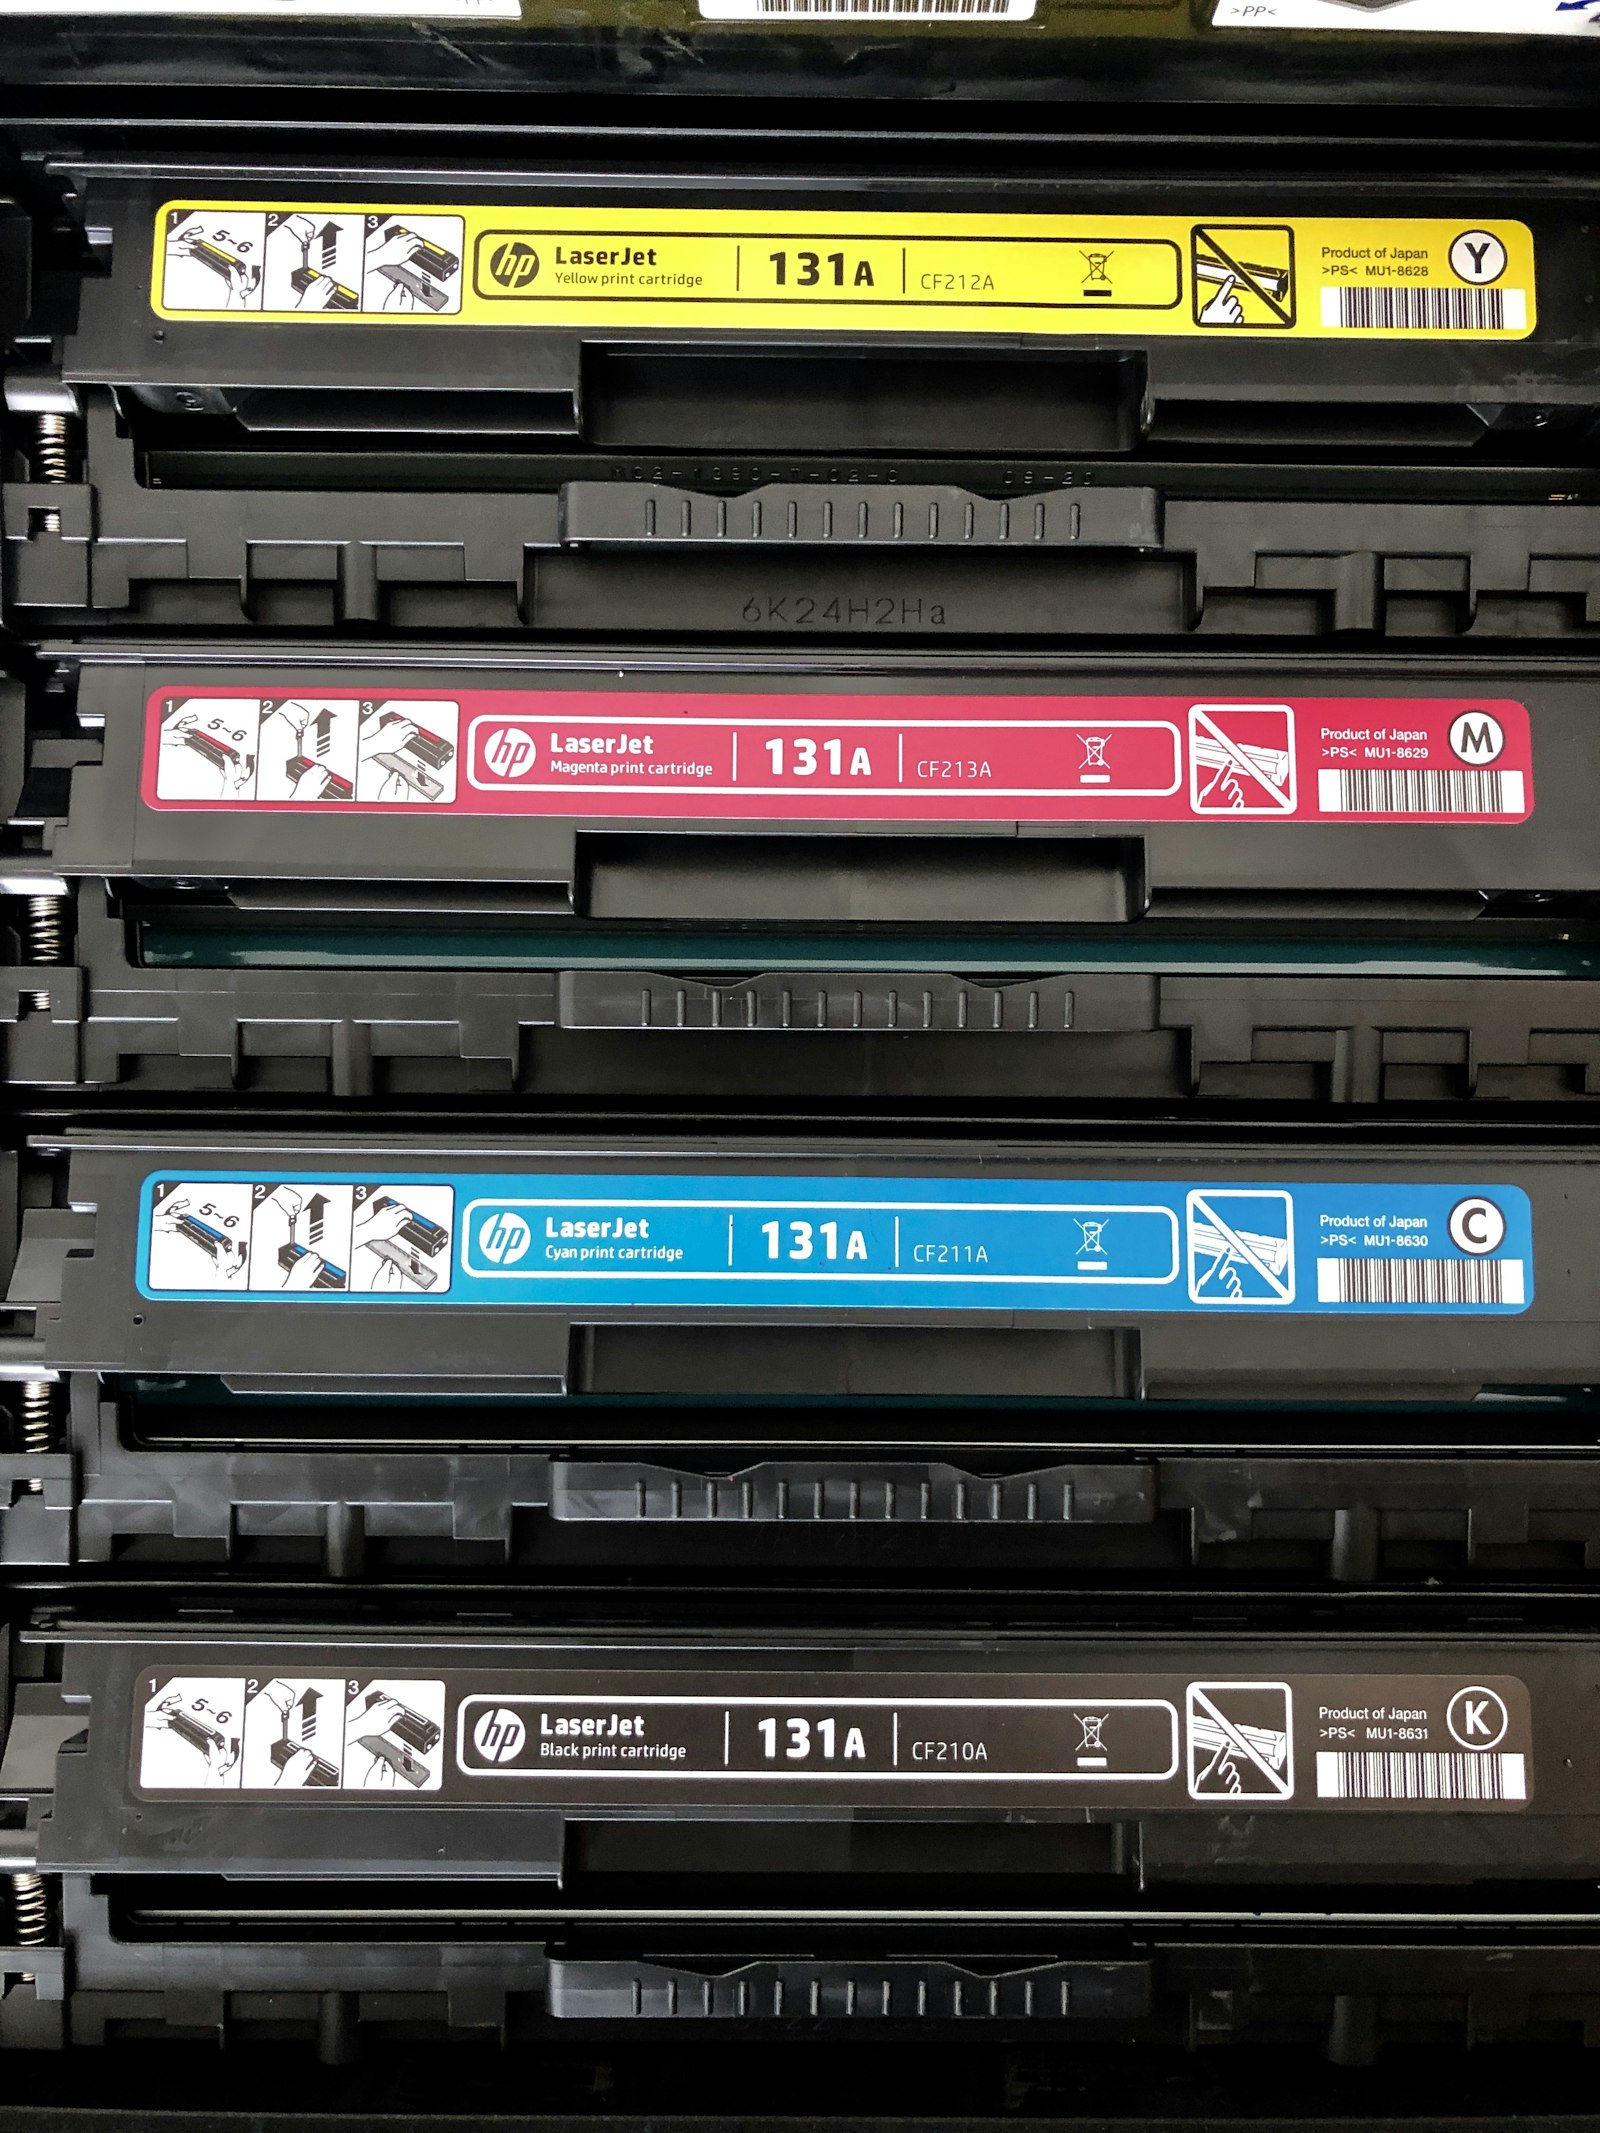
ISO 19798 was published in 2007 to extend the yield testing approach to color cartridges. The mechanical test is similar to 19752, but the test page differs. ISO 19798 uses a five page test pattern that includes business text, color graphics, photographic content, and a mix of fills and gradients. Coverage on the standard pattern runs roughly 5 percent per color across the four CMYK channels, but the distribution differs from page to page within the test set, simulating real document variety.
The five page pattern was designed to address the way different document types stress color cartridges differently. A page heavy on photo content uses cyan, magenta, and yellow disproportionately, while a page of black text on white uses only the K cartridge. Averaging the cartridge depletion across the pattern gives yield numbers per cartridge that approximate real mixed office workloads better than a single test page would.
The Spanish SMB office printing typical mixed business documents tends to land between 4 and 8 percent coverage on monochrome pages and roughly 5 percent per channel on color pages. Cartridge life in the field generally tracks the rated yield within plus or minus 15 percent, with offices running heavier graphics or denser text patterns wearing through cartridges faster. The everyday distinction between the testing assumption and what actually happens at the office is part of the broader cost picture covered at How a photocopier actually works in six clear steps, where the toner consumption mechanics are described.
How to translate yield to expected pages
 A 16,000 page rated cartridge produces 16,000 pages at 5 percent coverage. Adjusting for the office's actual coverage gives a more useful estimate. An office averaging 8 percent coverage per page burns through toner roughly 1.6 times as fast, producing about 10,000 pages per cartridge. An office averaging 4 percent coverage per page stretches the same cartridge to about 20,000 pages. The math is straightforward: divide the rated yield by the ratio of actual coverage to test coverage.
Most offices do not measure their actual coverage. The office IT team can pull coverage statistics from the MFP's internal counters, which track total pages and total toner volume. Dividing toner volume by page count produces an average coverage figure for the recent operating period. The number lets the office calibrate its cartridge purchase frequency to actual workload rather than to the brochure rating.
For an accounting firm running tax returns at higher than average coverage, the IT team often sees coverage figures around 10 percent. The implication is that cartridges last about half their rated yield in field conditions. Budgeting for cartridge replacement at half the brochure interval prevents running out during peak tax season. Where the broader story of cost per page on dealer service contracts intersects with toner yield calculations sits at What the industry copier segments from one through six actually mean for you, since segment level often dictates whether the contract is per page or per cartridge.
OEM versus compatible versus remanufactured yields
Original equipment manufacturer (OEM) toner cartridges produced by Canon, Ricoh, Xerox, Kyocera, Konica Minolta, Sharp, HP, and Brother carry yield ratings tested under ISO standards by the manufacturer. The numbers on the box are typically accurate within the standard's testing variance.
Compatible cartridges, produced by third party manufacturers and sold at lower price points, sometimes carry yield ratings that have been tested under ISO standards by the compatible maker. Sometimes the ratings are calculated by extrapolating from cartridge weight or toner volume rather than from full ISO testing. Reputable compatible makers like Static Control, Print Rite, and Innotec invest in proper ISO testing and publish reliable yield numbers. Less reputable suppliers cite numbers that may not match field performance.
 Remanufactured cartridges, where used OEM cartridges are cleaned and refilled with fresh toner, have variable yields depending on the remanufacturing quality. A properly remanufactured cartridge can match OEM yield within plus or minus 10 percent. A poorly remanufactured one runs short by 30 percent or more. The case for understanding cartridge sourcing as part of the broader cost picture, particularly where MPS contracts include both OEM and compatible options, comes through at The difference between duty cycle and recommended monthly volume and why it matters, since cartridge consumption and machine wear interact across the chassis lifecycle.
The high yield versus standard yield decision
Most cartridge model lines come in two or three yield variants. Standard yield. High yield. Sometimes extra high yield. The mechanical difference is the toner volume in the cartridge. A high yield cartridge holds more toner powder in a slightly larger reservoir while using the same chip and packaging. The price per cartridge is higher, but the price per page is lower.
The arithmetic on which yield to buy. Take the price per cartridge. Divide by the rated yield to get cost per page. Compare across yield variants. The high yield variant almost always wins on cost per page when the office prints enough volume to use the cartridge before it ages. Standard yield wins only on machines printing very low volume where the high yield cartridge would sit in the chassis for a year or more, since toner can dry out in extended storage and yield drops.
For a Spanish SMB office printing 4,000 monochrome pages per month, the high yield cartridge depletes in roughly four months and offers about 20 percent lower cost per page than standard yield. For a SOHO operation printing 500 pages per month, the standard yield cartridge depletes in about 18 months at 5 percent coverage and the high yield cartridge would sit unused, at risk of toner caking before it fully depletes. The everyday distinction between high volume and low volume scenarios, and where each tier of equipment fits, sits at When a single function printer makes more sense than a multifunction one.
Page yield on multi function devices versus single function
 An MFP and a desktop laser printer using the same cartridge model show different real world yields despite identical ISO ratings. The reason is that MFPs run additional internal cleaning cycles, calibration patterns, and maintenance routines that consume toner without producing user visible pages. The toner used for these internal operations gets counted against cartridge life but does not contribute to the page count the office sees.
For a typical office MFP, internal toner consumption runs around 5 to 10 percent of the cartridge volume across normal operation. A 16,000 page rated cartridge in field conditions on an MFP produces roughly 14,500 to 15,200 user visible pages, depending on the brand and the maintenance cycle frequency. Brand differences here are small but consistent. Kyocera tends to consume slightly less internal toner than Ricoh on similar workloads. Canon sits between the two. The internal consumption is one of the variables that makes brand to brand cost per page comparison harder than the brochure numbers suggest.
The case for cross brand cost analysis, where these subtle differences add up across a five year contract, ties back into the broader question of which segment fits which office. The deeper segment to operating cost mapping is at What the industry copier segments from one through six actually mean for you.
Reading the box correctly
A cartridge box typically lists the yield with one of three standard tags. Up to X pages at 5 percent coverage. Approximately X pages per ISO 19752. Yield rating per ISO 19798. The phrasing varies but the underlying test methodology is consistent across reputable manufacturers. The up to phrasing is a soft cap, with actual yields ranging from roughly 80 percent to 110 percent of the stated number depending on cartridge variation and machine condition.
Boxes that omit the ISO reference and list a yield without methodology should trigger caution. The number on the box may have been calculated under conditions that favor the manufacturer rather than under standardized ISO testing. Asking the supplier for ISO test documentation, or comparing the listed yield to the OEM equivalent yield for the same machine, reveals whether the third party number is trustworthy.
Some manufacturers list both rated yield and a more pessimistic field yield estimate. Brother sometimes does this on its TN series cartridges, listing the ISO yield alongside an estimate based on average office documents. The two numbers differ by 15 to 25 percent, with the field estimate being the lower figure. Treating the field estimate as the planning number for budget purposes produces more accurate cartridge replacement schedules.
Tracking actual yield across the cartridge lifecycle
Most office MFPs track cartridge usage in the controller. Pulling the device usage report from the operator panel or from the dealer fleet management dashboard reveals the actual page count produced per cartridge across the machine's history. Comparing the average to the rated yield reveals the office's effective coverage and toner consumption pattern.
The IT team in a 50 person Spanish SMB pulling the report sometimes sees that monochrome cartridges average 14,000 pages each on a 16,000 page rated cartridge, suggesting the office is running near 6 percent coverage. Color cartridges average 7,500 pages each on a 9,000 page rated cartridge, suggesting roughly 6 percent coverage on color as well. These figures inform both the budget for cartridge purchases and the understanding of whether the dealer service contract cost per page rate matches actual usage.
 For offices on managed print services, the MPS provider typically tracks these metrics automatically and adjusts cartridge replenishment to actual usage rather than to fixed schedules. The combination of automatic monitoring and just in time cartridge delivery removes the cartridge inventory management burden from the office IT team while keeping the supply pipeline aligned with actual coverage. The deeper mechanical view of how the chassis tracks toner usage at the developer unit level is at A guided tour of every part inside a modern office copier.
What yield numbers do not capture
Yield numbers measure cartridge depletion at standard test conditions but do not capture toner quality, color accuracy, drum impact, or long term storage stability. A high yield rating on a poorly formulated toner produces inconsistent output, color drift, and accelerated drum wear that the yield number alone does not reveal.
For everyday text printing the formulation differences between OEM and reputable compatible toners are small. For color printing of marketing collateral or photo output, the formulation differences become visible. Compatible color toners often produce slightly different color profiles than OEM, which matters for brand consistency on customer facing materials. Office IT teams managing color sensitive workflows usually keep at least one full set of OEM cartridges available alongside any compatible inventory, and reserve the OEM cartridges for color critical jobs.
Drum impact varies between toner formulations as well. Some compatible toners run slightly more abrasive than OEM, accelerating drum wear by 10 to 20 percent across a drum lifecycle. The cost savings on cartridges sometimes get partially absorbed by faster drum replacement. Where the broader chassis economics of these trade offs land, particularly across brands like Kyocera that engineer drums to last the life of the machine, sits at Whether laser LED or inkjet wins for office copying in 2026.
ISO 19752 measures monochrome yield. ISO 19798 measures color. Both assume 5 percent coverage. Real office coverage runs 4 to 8 percent on text and varies more on graphics. Adjusting the rated yield for actual coverage produces a usable estimate of cartridge life. OEM cartridges hit the ratings reliably. Reputable compatibles match within 10 percent. Less reputable suppliers cite numbers that do not always match field performance. Reading the standard alongside the brochure is what turns the headline figure into a planning number.